Hello All,
I was able to get some hands on experience with a Nutanix NX 3060 box recently and here are my observations regarding the box and its components and its functionalities.
Hardware –
Model NX-3060-G4
Number of Nodes 4
Number of Hosts 4
Hypervisor ESXi 6.0
Total num of disks 24 (8 SSD, 16 HDD)
User Interface
The user interface for Nutanix is PRISM
Once you power on the Block, the ip address of the management leads you to the web console as shown below:
Once you get in, the main console is really good. I liked the way the things are arranged on the main dashboard,
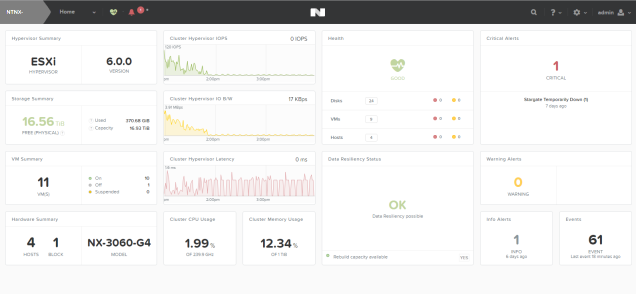
The main dashboard has the summary of the Hypervisor installed on the nodes in this block and its version. (here its ESXi 6.0), summary of storage capacity in the cluster as well as used storage and free storage available, summary of vms present on the esxi hosts in this cluster (4 node cluster), hardware summary of all the nodes present in this cluster, graphs on iops, latency and network bandwidth passing through the cluster. It also shows the overall CPU Usage, Cluster Memory Usage (which looks like it refreshes continuously) .
It also shows the overall health of the Nutanix Cluster which can be further drilled down to its respective components. It shows the Data resiliency status of the cluster. In this test machine, since it has 4 nodes in a cluster (default nodes to make a cluster are 3 nodes in Nutanix) the cluster is said to be resilient since it has more than 3 nodes.
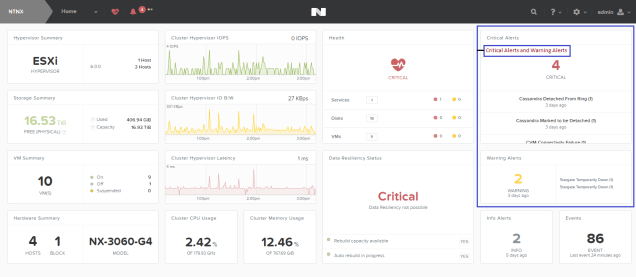
Alerts including Critical, Warning, Informational and Events are also displayed on the main dashboard once you login into the interface. It’s a good addition to see the critical alerts right when you login into the main web interface and you can drill down into the alert to know more info on that particular alert.
Here are some of the things I liked worthy of reviewing:
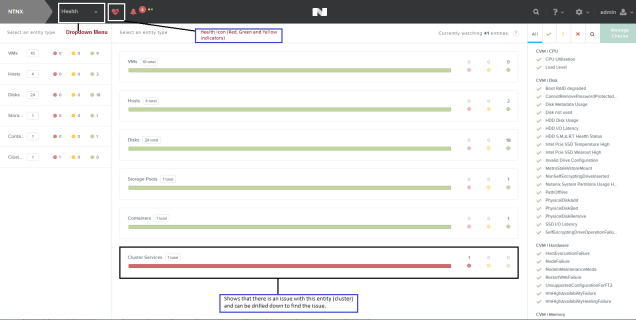
Health and state of the Nutanix Block as well as the virtual components (esxi hosts and vms)
The health of the Nutanix block is displayed on the main page once you login into Prism (Nutanix software which keeps track of all the components of a Nutanix block/cluster and provides a user web interface)
You can click on the scroll down menu on the top of the page and click on Health which displays all the component’s health in details which can again be drilled down to its components.
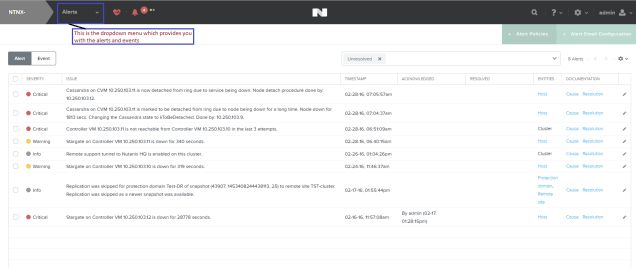
Alerts and Warnings of the components in the Nutanix Block
The web interface provides Critical alerts and multiple alerts right on the main web page after signing into the prism interface, these show you what the alert is and once you click on the alert, it will take you deeper to see the cause and resolution to the issue.
These can also be accessed through the Alert option from the dropdown menu
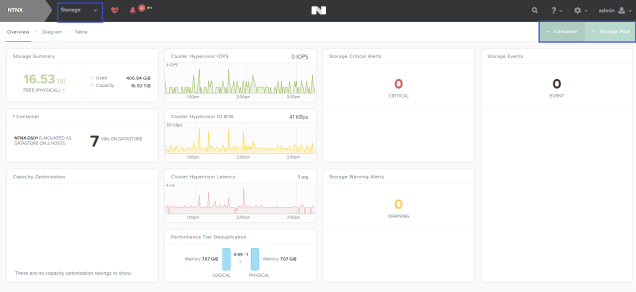
Storage and its ease of creation and providing the storage container to the esxi hosts
Creating a storage pool and creating a storage container in Nutanix we console is very easy and anyone without a background in storage can accomplish too. We do this by going into the Nutanix web console and clicking on the option storage from the dropdown menu on the top left side of the page.
Once in the storage page, click on storage pool and create a pool using all the disks presented or according to your requirements (Nutanix recommends to create one pool with all the available disks and create multiple containers), once the pool is complete, click on the container option in the same page beside the storage pool and create a container with your required space in the storage pool and you are all set to provide that container to the esxi host!
This view also shows you how many containers are present and how many vms are present on that container.
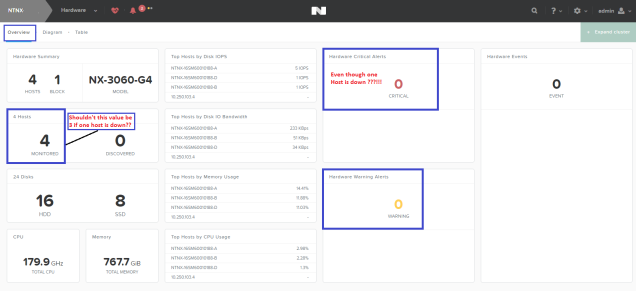
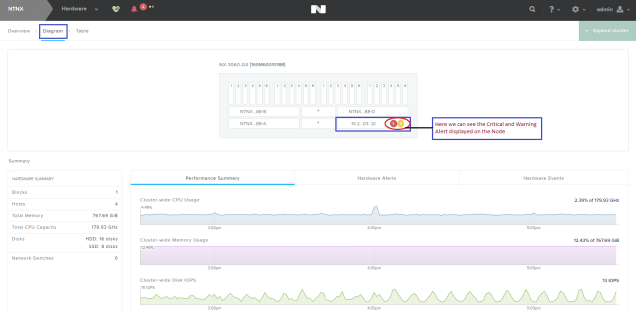
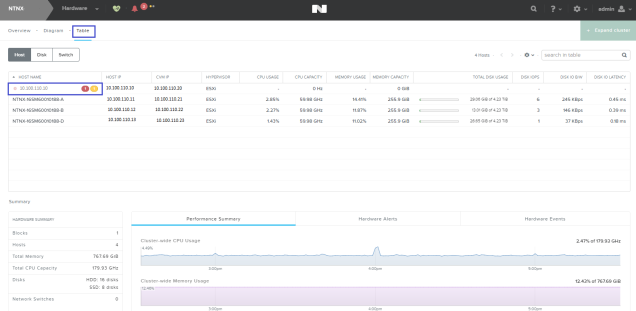
Things I observed which were not being reported correctly –
There were few things which I observed that were not being reported correctly in the Nutanix web console are the health of the hosts in the hardware view. I have a host down in my environment due to a metadata store issue and its down along with its controller vm but the Nutanix web console still doesn’t show it in its main overview of the Hardware tab, but reports it in Diagram and Table view.